Matplotlib图表
-

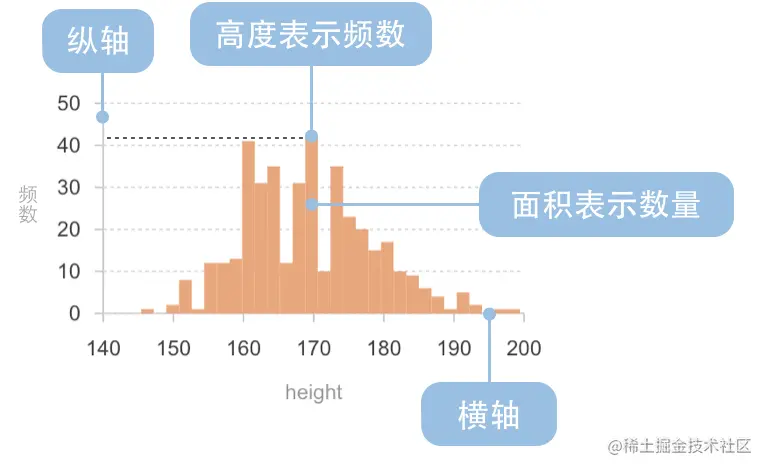
Matplotlib实战之直方图绘制详解
目录1. 主要元素2. 适用的场景3. 不适用的场景4. 分析实战4.1. 数据来源4.2. 数据清理4.3. 分析结编程客栈果可视化直方图,又称质量分布图,用于表示数据的分布情况,是一种常见的统计图表。[详细]
2023-11-19 10:33 分类:开发 -

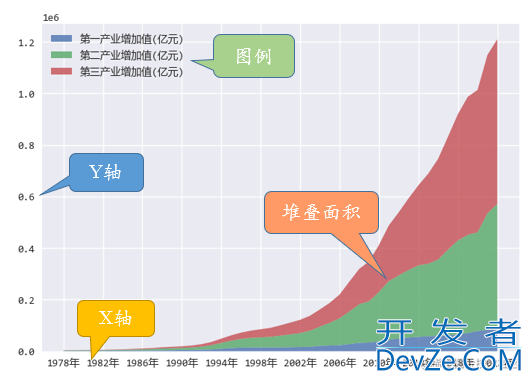
Matplotlib实战之堆叠面积图绘制详解
目录1. 主要元素2. 适用的场景3. 不适用的场景4. 分析实战4.1. 数据来源4.2. 数据清理4.3. 分析结果可视化堆叠面积图和面积图都是用于展示数据随时间变化趋势的统计图表,但它们的特点有所不同。[详细]
2023-11-19 10:18 分类:开发 sharing web user controls across projects
I\'ve done this using a regular .cs file that just extends System.Web.UI.UserControl and then included the assembly of the project that contains the control into other projects.I\'ve also created .asc[详细]
2022-12-28 17:11 分类:问答


 加载中,请稍侯......