wpF 实现饼状统计图
- 框架支持
.NET4 至 .NET8; Visual Studio 2022;
ChartPie 详解
新增依赖属性 Datas 存储饼图的数据,当数据发生更改时触发控件的重绘。
构造初始化颜色组 (vibrantColors) 为了区分每个扇形区显示不同的颜色。
绘制饼图
var drawingPen = CreatePen(2);
var boldDrawingPen = CreatePen(4);
var pieWidth = ActualWidth > ActualHeight ? ActualHeight : ActualWidth;
var pieHeight = ActualWidth > ActualHeight ? ActualHeight : ActualWidth;
centerX = pieWidth / 2;
centerY = pieHeight / 2;
radius = ActualWidth > ActualHeight ? ActualHeight / 2 : ActualWidth / 2;
- 计算饼图的宽度和高度,以确保饼图是圆形的。
- 计算圆心与半径。
绘制每个扇形
var angle = 0d;
var prevAngle = 0d;
var sum = Datas.Select(ser => ser.Value).Sum();
var index = 0;
var isFirst = false;
foreach (var item in Datas)
{
    // 计算起始和结束角度
    var arcStartX = radius * Math.Cos(angle * Math.PI / 180) + centerX;
    var arcStartY = radius * Math.Sin(angle * Math.PI / 180) + centerY;
    angle = item.Value / sum * 360 + prevAngle;
    var arcEndX = 0d;
    var arcEndY = 0d;
    if (Datas.Count() == 1 && angle == 360)
    {
        isFirst = true;
        arcEndX = centerX + Math.Cos(359.99999 * Math.PI / 180) * radius;
        arcEndY = radius * Math.Sin(359.99999 * Math.PI / 180) + centerY;
    }
    else
    {
        arcEndX = centerX + Math.Cos(angle * Math.PI / 180) * radius;
        arcEndY = radius * Math.Sin(angle * Math.PI / 180) + centerY;
    }

    var startPoint = new Point(arcStartX, arcStartY);
    var line1Segment = new LineSegment(startPoint, false);
    var isLargeArc = item.Value / sum > 0.5;
    var arcSegment = new ArcSegment
    {
        Size = new Size(radius, radius),
        Point = new Point(arcEndX, arcEndY),
        SweepDirection = SweepDirection.Clockwise,
        IsLargeArc = isLargeArc
    };
    var center = new Point(centerX, centerY);
    var line2Segment = new LineSegment(center, false);
    var pathGeometry = new PathGeometry(new[]
    {
        new PathFigure(center, new List<PathSegment>
        {
            line1Segment,
            arcSegment,
            line2Segment
        }, true)
    });

    pathGeometries.Add(pathGeometry,
        $"{item.Key} : {item.Value.FormatNumber()}");

    var backgroupBrush = new SolidColorBrush
    {
        Color = vibrantColors[
            index >= vibrantColors.Length
                ? index % vibrantColors.Length
                : index]
    };
    backgroupBrush.Freeze();
    drawingContext.DrawGeometry(backgroupBrush, null, pathGeometry);

    index++;
    if (!isFirst)
    {
        if (index == 1)
            drawingContext.DrawLine(boldDrawingPen, center, startPoint);
        else
            drawingContext.DrawLine(drawingPen, center, startPoint);
    }
    prevAngle = angle;
}
- 初始化角度
angle和prevAngle,计算数据总和(sum)。 - 循环
Datas集合,计算每条数据所需占的扇形区的起始角度和结束的角度。 - 如果只有一条数据那么角度为
360度,然后绘制圆形。 - 使用
ArcSegment绘制圆形的弧度,连接圆心和扇形区边缘。 - 将生成的
PathGeometry添加到pathGeometries中,并绘制每个的扇形区。 - 绘制每个扇形区的边框,根据索引设置画笔的宽度用于边框。
- 更新
prevAngle以用于计算下一个扇形区的角度。
1)新增 ChartPie.cs 代码如下:
using System;
using System.Collections.Generic;
using System.Linq;
using System.Windows;
using System.Windows.Controls;
using System.Windows.Controls.Primitives;
using System.Windows.Input;
using System.Windows.Media;
using System.Windows.Media.Effects;
using System.Windows.Shapes;
using WPFDevelopers.Core;

namespace WPFDevelopers.Controls
{
    public class ChartPie : Control
    {
        public static readonly DependencyProperty DatASProperty =
            DependencyProperty.Register("Datas", typeof(IEnumerable<KeyValuePair<string, double>>),
                typeof(ChartPie), new UIPropertyMetadata(DatasChanged));

        private Border _border;
        private Ellipse _ellipse;
        private KeyValuePair<PathGeometry, string> _lastItem;
        private Popup _popup;
        private StackPanel _stackPanel;
        private Textblock _textBlock;
        private double centerX, centerY, radius;
        private bool isPopupOpen;
        private readonly Dictionary<PathGeometry, string> pathGeometries = new Dictionary<PathGeometry, string>();

        private readonly Color[] vibrantColors;

        public ChartPie()
        {
            vibrantColors = new[]
            {
                Color.FromArgb(255, 84, 112, 198),
                Color.FromArgb(255, 145, 204, 117),
                Color.FromArgb(255, 250, 200, 88),
                Color.FromArgb(255, 238, 102, 102),
                Color.FromArgb(255, 115, 192, 222),
                Color.FromArgb(255, 59, 162, 114),
                Color.FromArgb(255, 252, 132, 82),
                Color.FromArgb(255, 154, 96, 180),
                Color.FromArgb(255, 234, 124, 204)
            };
        }

        public IEnumerable<KeyValuePair<string, double>> Datas
        {
            get => (IEnumerable<KeyValuePair<string, double>>) GetValue(DatasProperty);
            set => SetValue(DatasProperty, value);
        }

        private static void DatasChanged(DependencyObject d, DependencyPropertyChangedEventArgs e)
        {
            var ctrl = d as ChartPie;
            if (e.NewValue != null)
                ctrl.InvalidateVisual();
        }

        protected override void OnMouseMove(MouseEventArgs e)
        {
            base.OnMouseMove(e);
            if (Datas == null || Datas.Count() == 0 || isPopupOpen) return;
            if (_popup == null)
            {
                _popup = new Popup
                {
                    AllowsTransparency = true,
                    Placement = PlacementMode.MousePoint,
                    PlacementTarget = this,
                    StaysOpen = false
                };
                _popup.MouseMove += (y, j) =>
                {
                    var point = j.GetPosition(this);
                    if (isPopupOpen && _lastItem.Value != null)
                        if (!IsMouseoverGeometry(_lastItem.Key))
                        {
                            _popup.IsOpen = false;
                            isPopupOpen = false;
                            _lastItem = new KeyValuePair<PathGeometry, string>();
                        }
                };
                _popup.Closed += delegate { isPopupOpen = false; };

                _textBlock = new TextBlock
                {
                    HorizontalAlignment = HorizontalAlignment.Center,
                    VerticalAlignment = VerticalAlignment.Center,
                    Foreground = (Brush) Application.Current.TryFindResource("WD.WindowForegroundColorBrush"),
                    Padding = new Thickness(4, 0, 2, 0)
                };
                _ellipse = new Ellipse
                {
                    Width = 10,
                    Height = 10,
                    Stroke = Brushes.White
                };
                _stackPanel = new StackPanel {Orientation = Orientation.Horizontal};
                _stackPanel.Children.Add(_ellipse);
                _stackPanel.Children.Add(_textBlock);

                _border = new Border
                {
                    Child = _stackPanel,
                    Backgrounjsd = (Brush) Application.Current.TryFindResource("WD.ChartFillSolidColorBrush"),
                    Effect = Application.Current.编程TryFindResource("WD.PopupShadowDepth") as DropShadowEffect,
                    Margin = new Thickness(10),
                    CornerRadius = new CornerRadius(3),
                    Padding = new Thickness(6)
                };
                _popup.Child = _border;
            }

            var index = 0;
            foreach (var pathGeometry in pathGeometries)
            {
                if (IsMouseOverGeometry(pathGeometry.Key))
                {
                    isPopupOpen = true;
                    _ellipse.Fill = new SolidColorBrush
                    {
                        Color = vibrantColors[index >= vibrantColors.Length ? index % vibrantColors.Length : index]
                    };
                    _textBlock.Text = pathGeometry.Value;
                    _popup.IsOpen = true;
                    _lastItem = pathGeometry;
                    break;
                }

                index++;
            }
        }

        private bool IsMouseOverGeometry(PathGeometry pathGeometry)
        {
            var mousePosition = Mouse.GetPosition(this);
            return pathGeometry.FillContains(mousePosition);
        }

        protected override void OnRender(DrawingContext drawingContext)
        {
            base.OnRender(drawingContext);
            if (Datas == null || Datas.Count() == 0)
                return;
            SnapsToDevicePixels = true;
            UseLayoutRounding = true;
            pathGeometries.Clear();
            var drawingPen = CreatePen(2);
            var boldDrawingPen = CreatePen(4);
            var pieWidth = ActualWidth > ActualHeight ? ActualHeight : ActualWidth;
            var pieHeight = ActualWidth > ActualHeight ? ActualHeight : ActualWidth;
            centerX = pieWidth / 2;
            centerY = pieHeight / 2;
            radius = ActualWidth > ActualHeight ? ActualHeight / 2 : ActualWidth / 2;
            var angle = 0d;
            var prevAngle = 0d;
            var sum = Datas.Select(ser => ser.Value).Sum();
            var index = 0;
            var isFirst = false;
            foreach (var item in Datas)
            {
                var arcStartX = radius * Math.Cos(angle * Math.PI / 180) + centerX;
                var arcStartY = radius * Math.Sin(angle * Math.PI / 180) + centerY;
                angle = item.Value / sum * 360 + prevAngle;
                var arcEndX = 0d;
                var arcEndY = 0d;
                if (Datas.Count() == 1 && angle == 360)
                {
                    isFirst = true;
                    arcEndX = centerX + Math.Cos(359.99999 * Math.PI / 180) * radius;
                    arcEndY = radius * Math.Sin(359.99999 * Math.PI / 180) + centerY;
                }
                else
                {
                    arcEndX = centerX + Math.Cos(angle * Math.PI / 180) * radius;
                    arcEndY = radius * Math.Sin(angle * Math.PI / 180) + centerY;
                }

                var startPoint = new Point(arcStartX, arcStartY);
php                var line1Segment = new LineSegment(startPoint, false);
                var isLargeArc = item.Value / sum > 0.5;
                var arcSegment = new ArcSegment();
                var size = new Size(radius, radius);
                var endPoint = new Point(arcEndX, arcEndY);
                arcSegment.Size = size;
                arcSegment.Point = endPoint;
                arcSegment.SweepDirection = SweepDirection.Clockwise;
                arcSegment.IsLargeArc = isLargeArc;
                var center = new Point(centerX, centerY);
                var line2Segment = new LineSegment(center, false);

                var pathGeometry = new PathGeometry(new[]
                {
                    new PathFigure(new Point(centerX, centerY), new List<PathSegment>
                    {
                        line1Segment,
                        arcSegment,
                        line2Segment
                    }, true)
                });
                pathGeometries.Add(pathGeometry,
                    $"{item.Key} : {item.Value.FormatNumber()}");
                var backgroupBrush = new SolidColorBrush
                {
                    Color = vibrantColors[
                        index >= vibrantColors.Length
                            ? index % vibrantColors.Length
                            : index]
                };
                backgroupBrush.Freeze();

                drawingContext.DrawGeometry(backgroupBrush, null, pathGeometry);
                index++;
                if (!isFirst)
                {
                    if (index == 1)
                        drawingContext.DrawLine(boldDrawingPen, center, startPoint);
                    else
                        drawingContext.DrawLine(drawingPen, center, startPoint);
                }

                prevAngle = angle;
            }
        }

        private Pen CreatePen(double thickness)
        {
            var pen = new Pen
            {
                Thickness = thickness,
                Brush = Brushes.White
            };
            pen.Freeze();
            return pen;
        }
    }
}
2)新增 ChartPieExample.xaml 示例代码如下:
        <Grid Background="{DynamicResource WD.BackgroundSolidColorBrush}">
            <Grid.RowDefinitions>
                <RowDefinition />
                <RowDefinition Height="Auto" />
            </Grid.RowDefinitions>
            <ScrollViewer HorizontalScrollBarVisibility="Auto" VerticalScrollBarVisibility="Auto">
                <Border
                    Height="300"
                    Margin="30,0"
                    Background="{DynamicResource WD.BackgroundSolidColorBrush}">
                    <wd:ChartPie Datas="{Binding Datas, RelativeSource={RelativeSource AncestorType=local:ChartPieExample}}" />
                </Border>
            </ScrollViewer>
            <Button
                Grid.Row="1"
                Width="200"
                VerticalAlignment="Bottom"
                Click="Button_Click"
                Content="刷新"
                Style="{StaticResource WD.PrimaryButton}" />
        </Grid>
3)新增 ChartPieExample.xaml.cs 示例代码如下:
using System.Collections.Generic;
using System.Linq;
using System.Windows;
using System.Windows.Controls;

namespace WPFDevelopers.Samples.ExampleViews
{
    /// <summary>
    /// ChartPieExample.xaml 的交互逻辑
    /// </summary>
    public partial class ChartPieExample : UserControl
    {
        public IEnumerable<KeyValuePair<string, double>> Datas
        {
            get { return (IEnumerable<KeyValuePair<string, double>>)GetValue(DatasProperty); }
            set { SetValue(DatasProperty, value); }
        }

        public static readonly DependencyProperty DatasProperty =
            DependencyProperty.Register("Datas", typeof(IEnumerable<KeyValuePair<string, double>>), typeof(ChartPieExample), new PropertyMetadata(null));

        private Dictionary<string, IEnumerable<KeyValuePair<string, double>>> keyValues = new Dictionary<string, IEnumerable<KeyValuePair<string, double>>>();
        private int _index = 0;
        public ChartPieExample()
        {
            InitializeComponent();
            var models1 = new[]
            {
                new KeyValuePair<string, double>("Mon", 120),
                new KeyValuePair<string, double>("Tue", 530),
                new KeyValuePair<string, double>("Wed", 1060),
                new KeyValuePair<string, double>("Thu", 140),
                new KeyValuePair<string, double>("Fri", 8000.123456) ,
                new KeyValuePair<string, double>("Sat", 200) ,
                new KeyValuePair<string, double>("Sun", 300) ,
            };
            var models2 = new[]
            {
                new KeyValuePair&phplt;string, double>("Bing", 120),
                new KeyValuePair<string, double>("Google", 170),
                new KeyValuePair<pythonstring, double>("Baidu", 30),
                new KeyValuePair<string, double>("github", 200),
                new KeyValuePair<string, double>("Stack Overflow", 100) ,
                new KeyValuePair<string, double>("Runoob", 180) ,
                new KeyValuePair<string, double>("Open AI", 90) ,
                new KeyValuePair<string, double>("Open AI2", 93) ,
                new KeyValuePair<string, double>("Open AI3", 94) ,
                new KeyValuePair<string, double>("Open AI4", 95) ,
            };
            keyValues.Add("1", models1);
            keyValues.Add("2", models2);
            Datas = models1;
        }

        private void Button_Click(object sender, RoutedEventArgs e)
        {
            _index++;
            if (_index >= keyValues.Count)
            {
                _index = 0;
            }
            Datas = keyValues.ToList()[_index].Value;
        }
    }
}
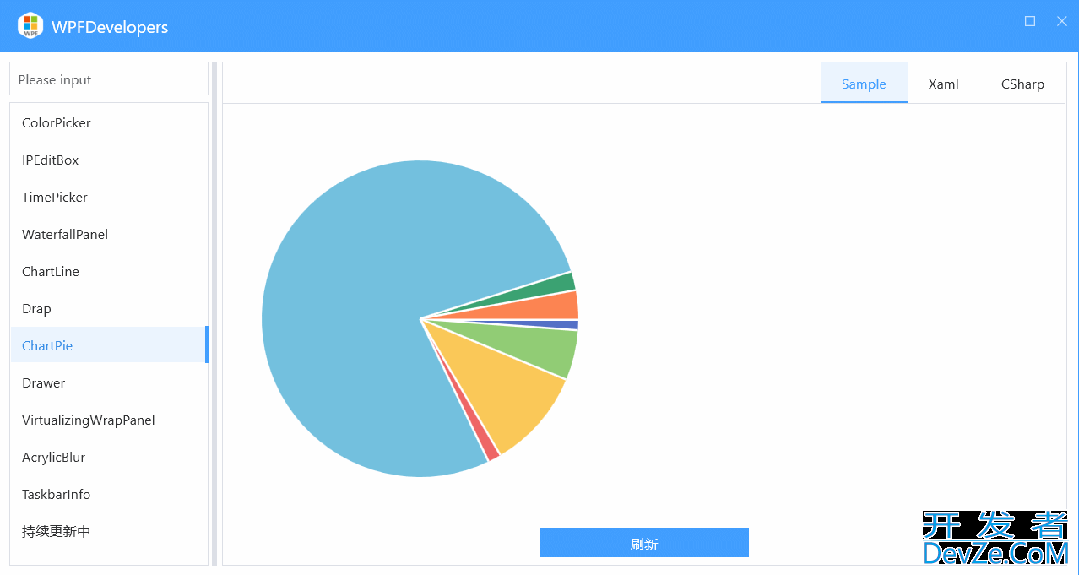
效果图

以上就是WPF实现绘制饼状统计图的示例代码的详细内容,更多关于WPF绘制饼状统计图的资料请关注编程客栈(www.devze.com)其它相关文章!


 加载中,请稍侯......
精彩评论