Let's say we have a parametric curve, for example a circle:
  x = r * cos(t)
  y = r * sin(t)
We want to plot the curve on the screen in a way that:
- every pixel is painted just once (the optimal par开发者_如何学编程t)
- there is a painted pixel for each (x, y) that lies on the curve (the continuous part)
If we just plot (x, y) for each t in [t1, t2], these conditions will not be met.
I am searching for a general solution for any parametric curve.
A general solution that 100% satisfies your criteria does not exist.
So we have to compromize.
Usually this is tackled by starting with a stepsize (usually a parameter to your routine), this stepsize can be subdivided triggered by a heuristic e.g.:
subdivide when the distance covered by a segment is larger than a given distance (e.g. one pixel)
subdivide when the curve direction changes too much
Or a combination of these.
Usually some limit to subdivision is also given to avoid taking forever.
Many systems that offer parametric plotting start with some changeable default setting for the heuristic params and step size. The user can adapt these if the curve is not "nice" enough or if it takes too long.
The problem is that there are always pathological curves that will defeat your method of drawing making it miss details or taking overly long.
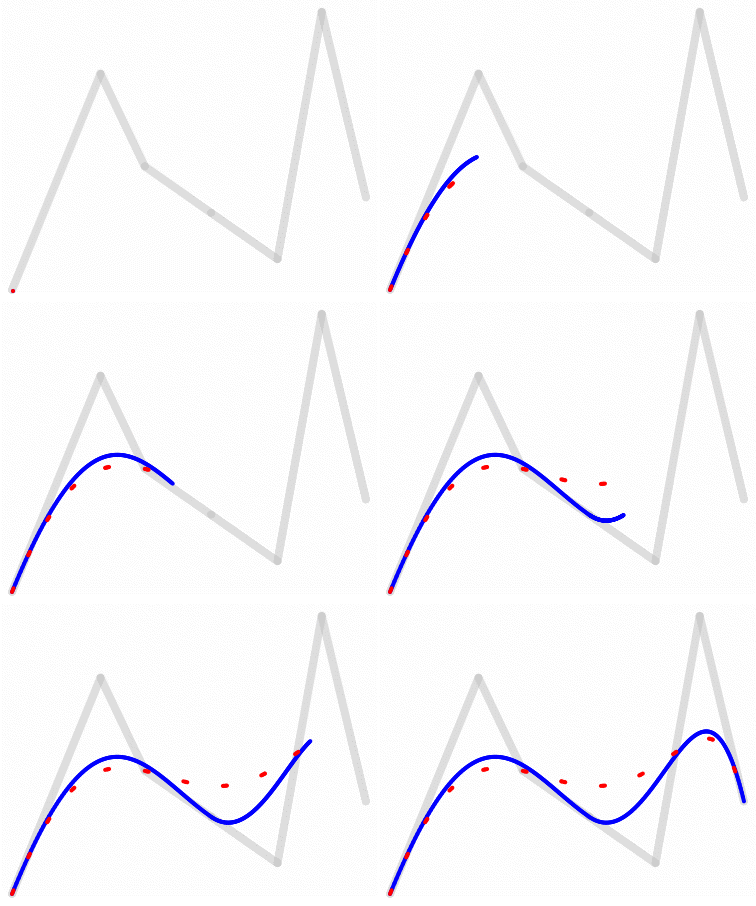
Check out Bézier splines.


![Interactive visualization of a graph in python [closed]](https://www.devze.com/res/2023/04-10/09/92d32fe8c0d22fb96bd6f6e8b7d1f457.gif)


 加载中,请稍侯......
精彩评论