I am running into trouble trying to compare and plot two files of different length. In MATLAB I do not know how to plot two vectors of different length in the same x-axis. As one file has some data missing, I want to create a row and put blank space for that开发者_如何学Python corresponding time stamp. Here are samples of data files:
file 1:
date time  T01  T02  T03  T04  T05
8/16/2009 0:00, 516.900024, 450.5,      465.200012, 546.799988, 539.700012
8/16/2009 0:10, 351.200012, 398.899994, 418.100006, 510.299988, 518.5
8/16/2009 0:30, 241.399994, 252.399994, 256,        360.600006, 386.5
8/16/2009 1:00, 184.199997, 154.300003, 143.899994, 236.600006, 244.399994
file 2:
date time  T01  T02  T03  T04  T05
8/16/2009 0:00, 656.799988, 611.200012, 860.599976, 604.700012, 288.5
8/16/2009 0:10, 527.400024, 359.200012, 789.099976, 789.099976, 446.799988
8/16/2009 0:20, 431.5,      327.100006, 763.599976, 895.099976, 689.099976
8/16/2009 0:30, 328.399994, 301.700012, 824,       1037.099976, 955.299988
8/16/2009 0:40, 261.5,      332.200012, 811.700012, 962.200012, 915.599976
8/16/2009 0:50, 180.300003, 291.100006, 700.099976, 855.200012, 836.900024
8/16/2009 1:00, 294.399994, 281.399994, 731.299988, 881.700012, 666.200012
8/16/2009 1:10, 274.899994, 334.200012, 759.400024, 913.900024, 760.799988
I am trying to remake file 1 as follows:
8/16/2009 0:00, 516.900024, 450.5,      465.200012, 546.799988, 539.700012
8/16/2009 0:10, 351.200012, 398.899994, 418.100006, 510.299988, 518.5
8/16/2009 0:20, ,,,,
8/16/2009 0:30, 241.399994, 252.399994, 256,        360.600006, 386.5
8/16/2009 0:40, ,,,,
8/16/2009 0:50, ,,,,
8/16/2009 1:00, 184.199997, 154.300003, 143.899994, 236.600006, 244.399994
8/16/2009 1:10, ,,,,
Is there a way to do this? it would help me a lot as I am trying to link up 2 files based on time stamps.
p.s.: I am trying to use the ismember function in MATLAB and am having all sorts of problems.
I assume you are first reading data from the files as described in the answers to this question. If you have the time-stamps (converted using DATENUM) and data from the two files stored in variables fileData1 and fileData2, the following is a simple way to plot data from each on the same set of axes (using the function PLOT and the HOLD command):
t1 = fileData1(:,1);  %# Time-stamps for file 1
d1 = fileData1(:,2);  %# First column of data for file 1
plot(t1,d1,'ro-');    %# Plot data from file 1, using a red line with circles
hold on;
t2 = fileData2(:,1);  %# Time-stamps for file 2
d2 = fileData2(:,2);  %# First column of data for file 2
plot(t2,d2,'bo-');    %# Plot data from file 2, using a blue line with circles
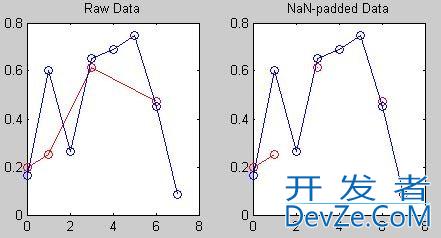
Each line in the above plot will have a different number of time points (i.e. circle markers), but each will be a continuous (i.e. unbroken) line. If you want to show breaks in the plot where there are missing time-stamps, you can pad the data from file 1 with NaN values. If you know for sure that there are never time-stamps in the smaller file that aren't in the larger file (i.e. that the time-stamps in the smaller file are a subset of the time-stamps in the larger), then you can use the function ISMEMBER as follows:
newData = nan(size(fileData2));      %# New file 1 data, initialized to NaN
t = fileData2(:,1);                  %# Use the time-stamps from file 1
index = ismember(t,fileData1(:,1));  %# Find row indices of common time-stamps
newData(:,1) = t;                    %# Copy time-stamps
newData(index,:) = fileData1;        %# Copy data
If there are time-stamps in the smaller file that aren't in the larger, then you will have to use a solution based on the INTERSECT function (as illustrated in my answer to your other related question).
And now, you can plot the data using the following:
d1 = newData(:,2);            %# First column of padded data for file 1
d2 = fileData2(:,2);          %# First column of data for file 2
plot(t,d1,'ro-',t,d2,'bo-');  %# Plot both lines
Here's a sample of the difference NaN-padding makes when plotting (using some randomly generated data):


![Interactive visualization of a graph in python [closed]](https://www.devze.com/res/2023/04-10/09/92d32fe8c0d22fb96bd6f6e8b7d1f457.gif)


 加载中,请稍侯......
精彩评论