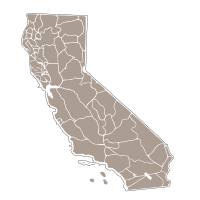
I'm working on a map of the native languages of California for Wikipedia. The map contains areas that each correspond to a language. The original looks like this (click it to see the SVG):

I want to make "locator maps" for each of those individual languages by hand (in Inkscape), like this one, for a language called Cahuilla (which has the language code cah):

Needless to say, doing this would be a pain in the neck if I generated all 60-some by hand in Inkscape.
Worse, whenever I find a mistake in the original, I'd have to redo the whole set of locator maps. (And in fact I recently realized that my original is missing one language entirely. Sorry Cupeño.)
So my goal is to automate this process. I don't have much experience processing SVG or even XML, so I'm looking for recommendations as to which libraries would be most helpful. I'd prefer solutions in Python, sincely I'm not hopeless in that language.
To summarize, I need to:
Get a list of references to all the language shapes in the original SVG file.
For each language in this list:
change the background color of the shape for the current language
put a box around the language
duplicate the box and scale it to a given size (I recognize that in this step it might be difficult to ac开发者_如何学Pythontually "crop" the surrounding shapes as I did in my example -- just creating a box with the language shape on a white background would be sufficient.)
place the duplicate in the upper right corner
save all this stuff in code.svg
The final product will then be 60 SVG files named cah.svg, etc. Better yet, it would be possible to re-generate the whole shebang if it became necessary to edit the original map (which is quite likely).
I would recommend using Python and specifically creating extensions for Inkscape. I don't think you really need 60 SVG unless you really want to because the source map will have everything you need.
What I would do is use Inkscape to rename the various regions to the same language code you will be using. For example, Cahuilla or cah is currently path13882 in your SVG file. I would rename it to cah or Cahuilla and repeat the process for each of the language regions. Use the Edit\XML Editor to help make sure you update all of the paths.
After you have updated the names/IDs, then you might look into SVG scripting. I would just create a javascript/ecmascript map or dictionary that has the relevant information for the language:
var langaugeMap = {};
languageMap["cah"] = { name: "Cahuilla", color: "rgb(255, 0, 0)" };
languageMap["cup"] = { name: "Cupeño", color: "rgb(255, 64, 0)" };
// and so on -- this could even be generated from a CSV file or Excel, etc.
// if the highlighted color is always the same, then you don't need it in the map
// or use style sheets for an activeshape and inactiveshape
// Put any information that is specific to a language in the map
Then you just need to add a mouseover function that would add and position the bounding box and change the path color. Here is one example of events and scripting although it is quite dated. Carto.net has an interactive map example as well.
The SVG would look something like:
<path
   style="fill:#800000;fill-opacity:1;display:inline"
   d="m 422.43078,517.40746 c 0.52151,0.006 1.10755,0.0374 1.75925,0.0825 3.82011,0.26462 5.01088,0.75501 5.75001,2.37491 0.51312,1.12355 2.4121,3.0097 4.22213,4.1946 3.906,2.55656 7.38824,2.07964 9.61517,-1.3194 2.12996,-3.25075 9.13451,-3.19196 13.61739,0.11545 1.77185,1.30707 4.04994,2.38037 5.06319,2.38041 1.01325,0 3.34593,0.92548 5.18421,2.06155 2.52816,1.56236 4.9918,2.09869 10.09889,2.19902 3.71359,0.0729 7.68145,0.64349 8.82374,1.26442 2.81717,1.53202 5.67633,1.42382 10.7693,-0.40133 4.97461,-1.78261 6.31161,-1.36525 17.10267,5.31063 3.39862,2.10239 6.90491,4.08094 7.7956,4.39801 2.46593,0.8776 4.55428,4.66976 3.95259,7.17971 -0.29359,1.22605 -0.75898,3.51121 -1.03349,5.07968 -0.27411,1.56855 -0.88382,3.33952 -1.35761,3.93621 -1.50842,1.89871 -20.98501,7.77151 -27.8945,8.41122 -3.66014,0.33879 -8.3091,1.04337 -10.32987,1.56676 -3.50666,0.90799 -3.81743,0.79746 -6.78388,-2.44089 -3.3486,-3.65594 -6.11308,-4.2716 -8.48815,-1.89661 -2.14408,2.14401 -1.85126,3.96434 1.0667,6.66846 1.40725,1.30409 1.85699,2.10446 1.00027,1.77571 -0.85672,-0.32883 -6.3937,-0.12213 -12.3033,0.46176 -5.9096,0.58386 -12.56062,1.27336 -14.78297,1.53381 -4.17058,0.4888 -5.09869,-0.37014 -2.61673,-2.42989 2.1563,-1.78956 1.74245,-2.63318 -1.65999,-3.36449 -1.69931,-0.36525 -4.94789,-1.90738 -7.213,-3.42496 -2.26473,-1.51754 -5.89662,-3.66823 -8.07583,-4.77731 -2.17921,-1.10923 -6.21922,-3.94186 -8.97721,-6.29463 -4.75318,-4.05478 -4.93682,-4.36681 -3.43604,-6.02527 0.96935,-1.07117 2.36209,-1.56397 3.5899,-1.26992 1.62639,0.38937 2.49494,-0.41237 4.59588,-4.24958 1.42481,-2.60257 2.23686,-4.95457 1.80316,-5.22266 -0.4337,-0.26805 -1.06784,-3.14557 -1.40725,-6.39358 -0.33978,-3.24797 -1.19001,-6.79064 -1.89134,-7.87242 -1.74322,-2.68957 -1.2114,-3.65437 2.44111,-3.61188 l 0,0 z"
   id="cah"
   inkscape:label="#cah"
   onmouseover="highlightRegion(evt);"
   onmouseout="restoreRegion(evt);" />
For any automation with the SVG file, I would use Inkscape extensions. Look at the Inkscape wiki under the Developer Tutorials / Extensions. Otherwise, SVG is still XML so if you have named your language regions in the source file with a distinguishing name, you could use Python to parse the XML and save each path/language region to a separate file.
Here's an example using your map. You can click any element to get the boundingbox, this can be used for the miniview viewBox (with some tweaking). As you see it's not adding much code to the map, just a couple of elements. When you have all the viewBoxes you can update the miniview 'viewBox' attribute on the fly using javascript.
For the coloring of the selected shape, I'd suggest adding a <use> element inside the miniview <svg> that has a fill that overrides any fill used in the main map (you may have to use a stylesheet rule for this to make sure it's got high specificity, e.g adding #miniview .activeshape { fill: red !important }. Let the <use> point to the selected shape, and make sure you add class="activeshape" on the shape you point to.
This should be a start at least, hope it helps :)


![Interactive visualization of a graph in python [closed]](https://www.devze.com/res/2023/04-10/09/92d32fe8c0d22fb96bd6f6e8b7d1f457.gif)


 加载中,请稍侯......
精彩评论