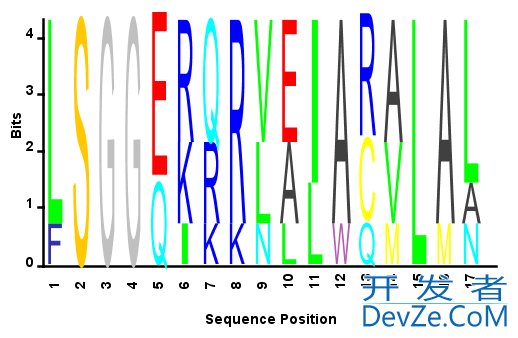
In Matlab, I want to make a seqlogo plot o开发者_开发问答f an amino acid sequence profile. But instead of scaling the heights of the plot columns by entropy, I want all the columns to be the same height.
I'm in the process of modifying the code from the answers to this question, but I wonder if there is a parameter to seqlogo or some other function that I have missed that will make the column heights uniform.
Alternatively, is there a statistical transformation I can apply to the sequence profile to hack the desired output? (column heights uniform, height of each letter linearly proportion to its probability in the seqprofile)
Probably the easiest way around this problem is to directly modify the code for the Bioinformatics Toolbox function SEQLOGO (if possible). In R2010b, you can do:
edit seqlogo
And the code for the function will be shown in the editor. Next, find the following lines (lines 267-284) and either comment them out or remove them entirely:
S_before = log2(nSymbols);
freqM(freqM == 0) = 1; % log2(1) = 0

% The uncertainty after the input at each position
S_after = -sum(log2(freqM).*freqM, 1);

if corrError
    % The number of sequences correction factor
    e_corr = (nSymbols -1)/(2* log(2) * numSeq);
    R = S_before - (S_after + e_corr);
else
    R = S_before - S_after;
end

nPos = (endPos - startPos) + 1;
for i =1:nPos
    wtM(:, i) = wtM(:, i) * R(i);
end
Then put this line in their place:
wtM = bsxfun(@times,wtM,log2(nSymbols)./sum(wtM));
You will probably want to save the file under a new name, like seqlogo_norm.m, so you can still use the original unmodified SEQLOGO function. Now you can create sequence profile plots with all the columns normalized to the same height. For example:
S = {'LSGGQRQRVAIARALAL',...      %# Sample amino acid sequence
     'LSGGEKQRVAIARALMN',...
     'LSGGQIQRVLLARALAA',...
     'LSGGERRRLEIACVLAL',...
     'FSGGEKKKNELWQMLAL',...
     'LSGGERRRLEIACVLAL'};
seqlogo_norm(S,'alphabet','aa');  %# Use the modified SEQLOGO function

OLD ANSWER:
I'm not sure how to transform the sequence profile information to get the desired output from the Bioinformatics Toolbox function SEQLOGO, but I can show you how to modify the alternative seqlogo_new.m that I wrote for my answer to the related question you linked to. If you change the line that initializes bitValues from this:
bitValues = W{2};
to this:
bitValues = bsxfun(@rdivide,W{2},sum(W{2}));
Then you should get each column scaled to a height of 1. For example:
S = {'ATTATAGCAAACTA',...  %# Sample sequence
     'AACATGCCAAAGTA',...
     'ATCATGCAAAAGGA'};
seqlogo_new(S);            %# After applying the above modification

For now, my workaround is to generate a bunch of fake sequences that match the sequence profile, then feed those sequences to http://weblogo.berkeley.edu/logo.cgi . Here is the code to make the fake sequences:
function flatFakeSeqsFromPwm(pwm, letterOrder, nSeqsToGen, outFilename)
%translates a pwm into a bunch of fake seqs with the same probabilities
%for use with http://weblogo.berkeley.edu/

%pwm should be a 4xn or a 20xn position weight matrix. Each col must sum to 1
%letterOrder = e.g. 'ARNDCQEGHILKMFPSTWYV' for my data
%nSeqsToGen should be >= the # of pixels tall you plan to make your chart

[height windowWidth] = size(pwm);
assert(height == length(letterOrder));
assert(isequal(abs(1-sum(pwm)) < 1.0e-10, ones(1, windowWidth))); %assert all cols of pwm sum to 1.0

fd = fopen(outFilename, 'w');

for i = 0:nSeqsToGen-1
    for seqPos = 1:windowWidth
        acc = 0; %accumulator
        idx = 0;
        while i/nSeqsToGen >= acc
            idx = idx + 1;
            acc = acc + pwm(idx, seqPos);
        end
        fprintf(fd, '%s', letterOrder(idx));
    end
    fprintf(fd, '\n');
end

fclose(fd);
end


![Interactive visualization of a graph in python [closed]](https://www.devze.com/res/2023/04-10/09/92d32fe8c0d22fb96bd6f6e8b7d1f457.gif)


 加载中,请稍侯......
精彩评论